





Analytics
Growth Dashboards
Visualise your recruitment agency's performance with fully customisable dashboards tailored to your unique business metrics.
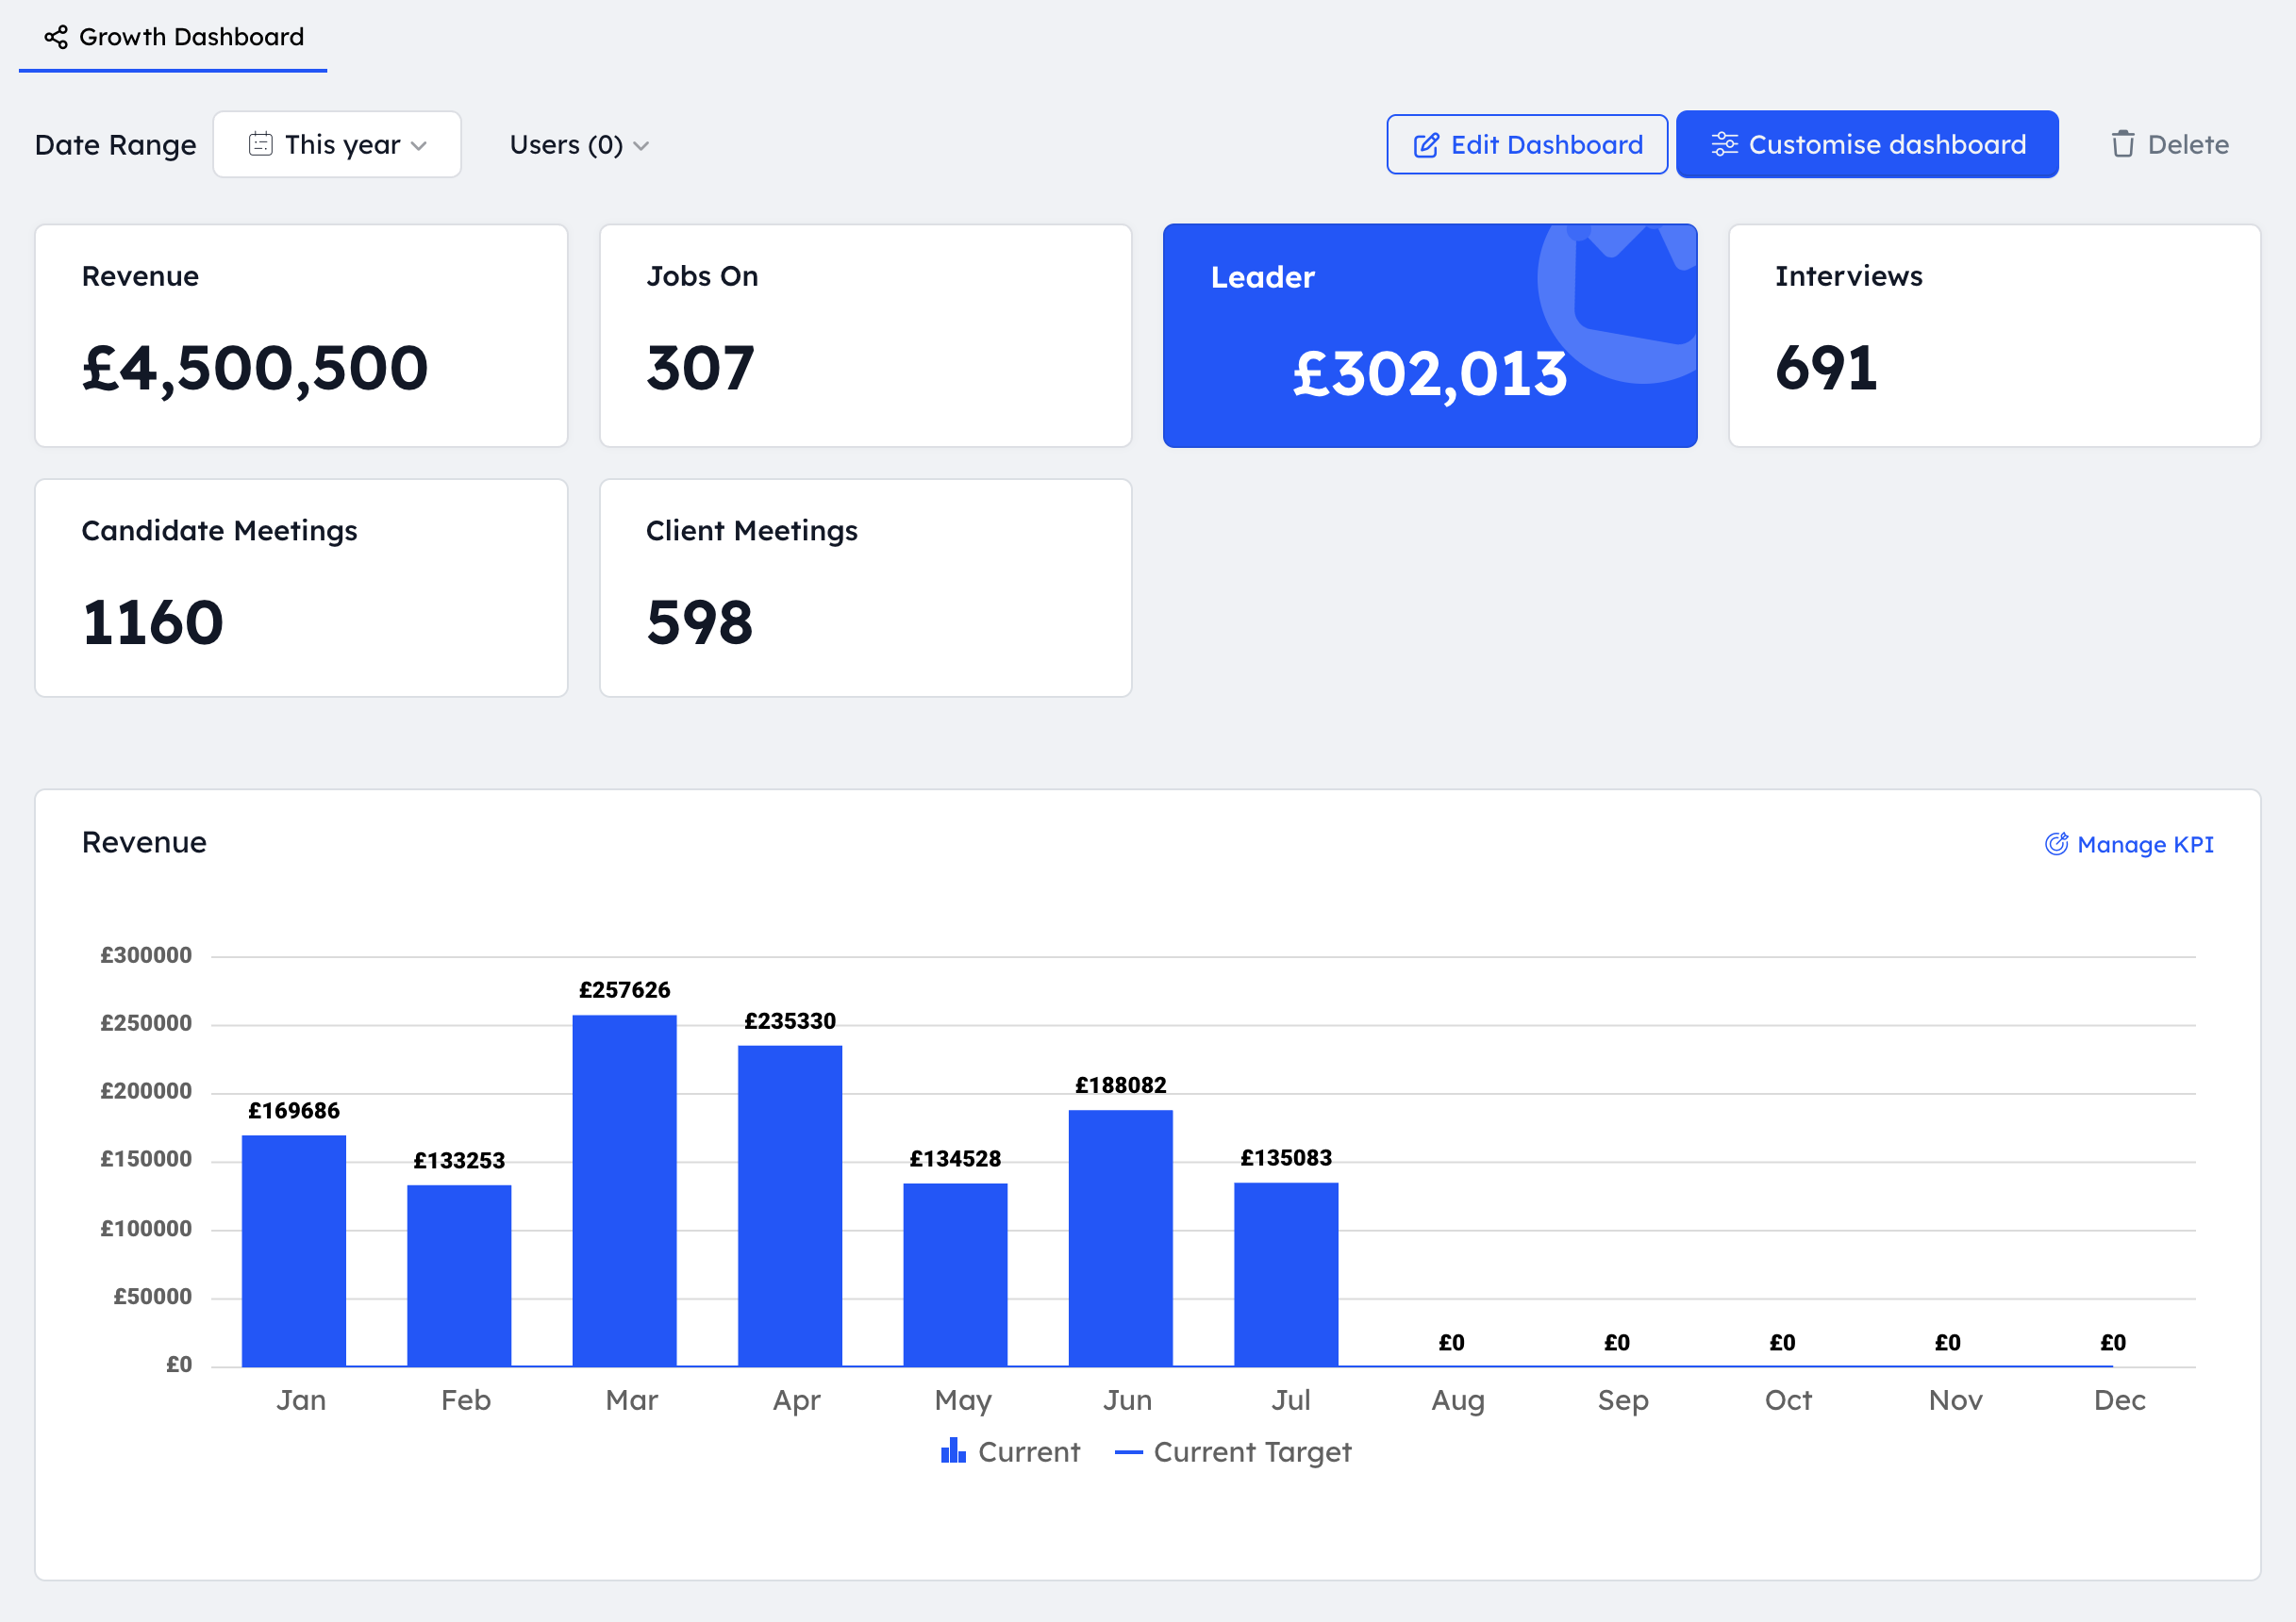
Generic dashboards rarely provide the specific insights recruitment agencies need to drive growth. Recruitly's Custom Growth Dashboards transform how you visualise and act on your performance data with tailored solutions designed for your unique business model.
personalised Performance Visualisation
Working closely with your team, we design custom dashboard widgets that track exactly what matters to your business. Whether you need specialised billing metrics, team performance comparisons, or unique KPIs specific to your recruitment niche, our dashboards deliver the insights that drive better decisions.
Real-Time Growth Tracking
Monitor your key performance indicators in real-time with dynamic visualisations that update automatically. These custom dashboards eliminate the need for manual reporting and provide instant visibility into your business trajectory, helping you identify trends and opportunities as they emerge.
Multi-Level Performance Views
Our custom dashboards can be configured for different organizational levels, providing executives, managers, and individual contributors with the specific metrics they need. From company-wide growth trends to team comparisons and individual performance, each stakeholder gets relevant insights.
Visual Goal Tracking
Transform abstract targets into visual progress indicators that motivate your team. Custom goal widgets clearly display progress against targets, highlighting achievements and identifying areas needing attention, creating a performance-focused culture.
Interactive Data Exploration
Go beyond static reporting with interactive dashboards that allow users to explore data dynamically. Drill down into specific metrics, filter by time periods or teams, and generate on-demand comparisons to uncover deeper insights.
Integrated Business Intelligence
Custom dashboards seamlessly integrate data from across your recruitment operations, creating a unified view of your business. This consolidated approach eliminates silos and provides a comprehensive understanding of how different activities impact your bottom line.
Use cases
Executive Leadership
Provide leadership teams with high-level growth metrics and performance trends to inform strategic decisions.
Team Management
Help managers track team performance, identify coaching opportunities, and optimise resource allocation.
Specialised Recruitment Metrics
Track industry-specific recruitment metrics unique to your vertical, such as creative placement rates or technical skill matching.
Multi-Office Comparison
Compare performance across different locations or divisions to identify best practices and improvement opportunities.
Revenue and Growth Forecasting
Visualise pipeline metrics and historical trends to create more accurate business forecasts and projections.
Integrations
Questions
While standard reporting covers common recruitment metrics, Custom Growth Dashboards are tailored specifically to your business model, KPIs, and strategic goals. We work closely with your team to understand exactly what metrics drive your success and design visualisation widgets that track those specific indicators. This might include unique billing structures, team organizations, performance incentives, or industry-specific metrics that aren't part of standard recruitment reporting.
Typical implementation takes 2-4 weeks, depending on complexity. The process begins with a discovery session to understand your unique requirements, followed by dashboard design, data integration, and customization. We work iteratively, gathering feedback on initial versions and refining the dashboards until they perfectly match your needs. Once deployed, we provide training and ongoing support to ensure maximum value.
Yes, we can create role-specific dashboard views that show relevant metrics to different stakeholders. Executives might see high-level growth and revenue metrics, managers might focus on team performance comparisons, while individual recruiters could see their personal KPIs and targets. Access permissions ensure users only see data appropriate to their role.
Our dashboard widgets are highly customisable in terms of metrics, visualisation type, data sources, time periods, and appearance. We can create specialised charts, gauges, leaderboards, heat maps, goal trackers, or any other visualisation that effectively communicates your key metrics. Each widget can incorporate custom calculations, comparisons, and thresholds specific to your business requirements.
Yes, our Custom Growth Dashboards can integrate data from multiple sources to provide a complete picture of your business performance. We can incorporate data from financial systems, marketing platforms, external databases, or other operational tools. This allows for comprehensive views that connect recruitment activities to broader business outcomes and metrics.
Key benefits
Gain visibility into the exact metrics that drive your business growth
Make data-driven decisions with real-time performance insights
Motivate teams with clear visualisation of goals and achievements
Identify trends and opportunities faster with tailored analytics
Eliminate time spent creating manual reports and spreadsheets
Track specialised KPIs unique to your recruitment niche
Compare performance across teams, individuals, and time periods
Demonstrate ROI and business impact to stakeholders with clear visualisations
Improve forecasting accuracy with historical trend analysis
Create a performance-focused culture with transparent metrics
How it works
Tailored Widget Creation
Custom-designed visualisation widgets built specifically for your unique business metrics and KPIs, beyond standard recruitment metrics.
Executive Dashboards
High-level views designed for leadership teams, focusing on growth indicators, revenue forecasting, and strategic performance metrics.
Team Performance Boards
Comparative visualisations showing performance across different teams, offices, or recruitment specialties with customisable metrics.
Individual Achievement Tracking
personalised consultant dashboards showing individual performance against targets, activity metrics, and comparison to peers.
Custom Data Integration
Integration of data from various sources within and outside Recruitly to create comprehensive performance visualisations.
Interactive Filtering
Dynamic controls that allow users to explore data by different dimensions, time periods, or categories for deeper analysis.
See Growth Dashboards on your own data
Start free and try it, or have someone walk you through it on a call.
Best Value & Best Ease of Use · Capterra 2026