





Recruiting
KPI/Goals & Widgets
Monitor critical recruitment metrics in real-time with customisable dashboard widgets and visual KPI tracking.
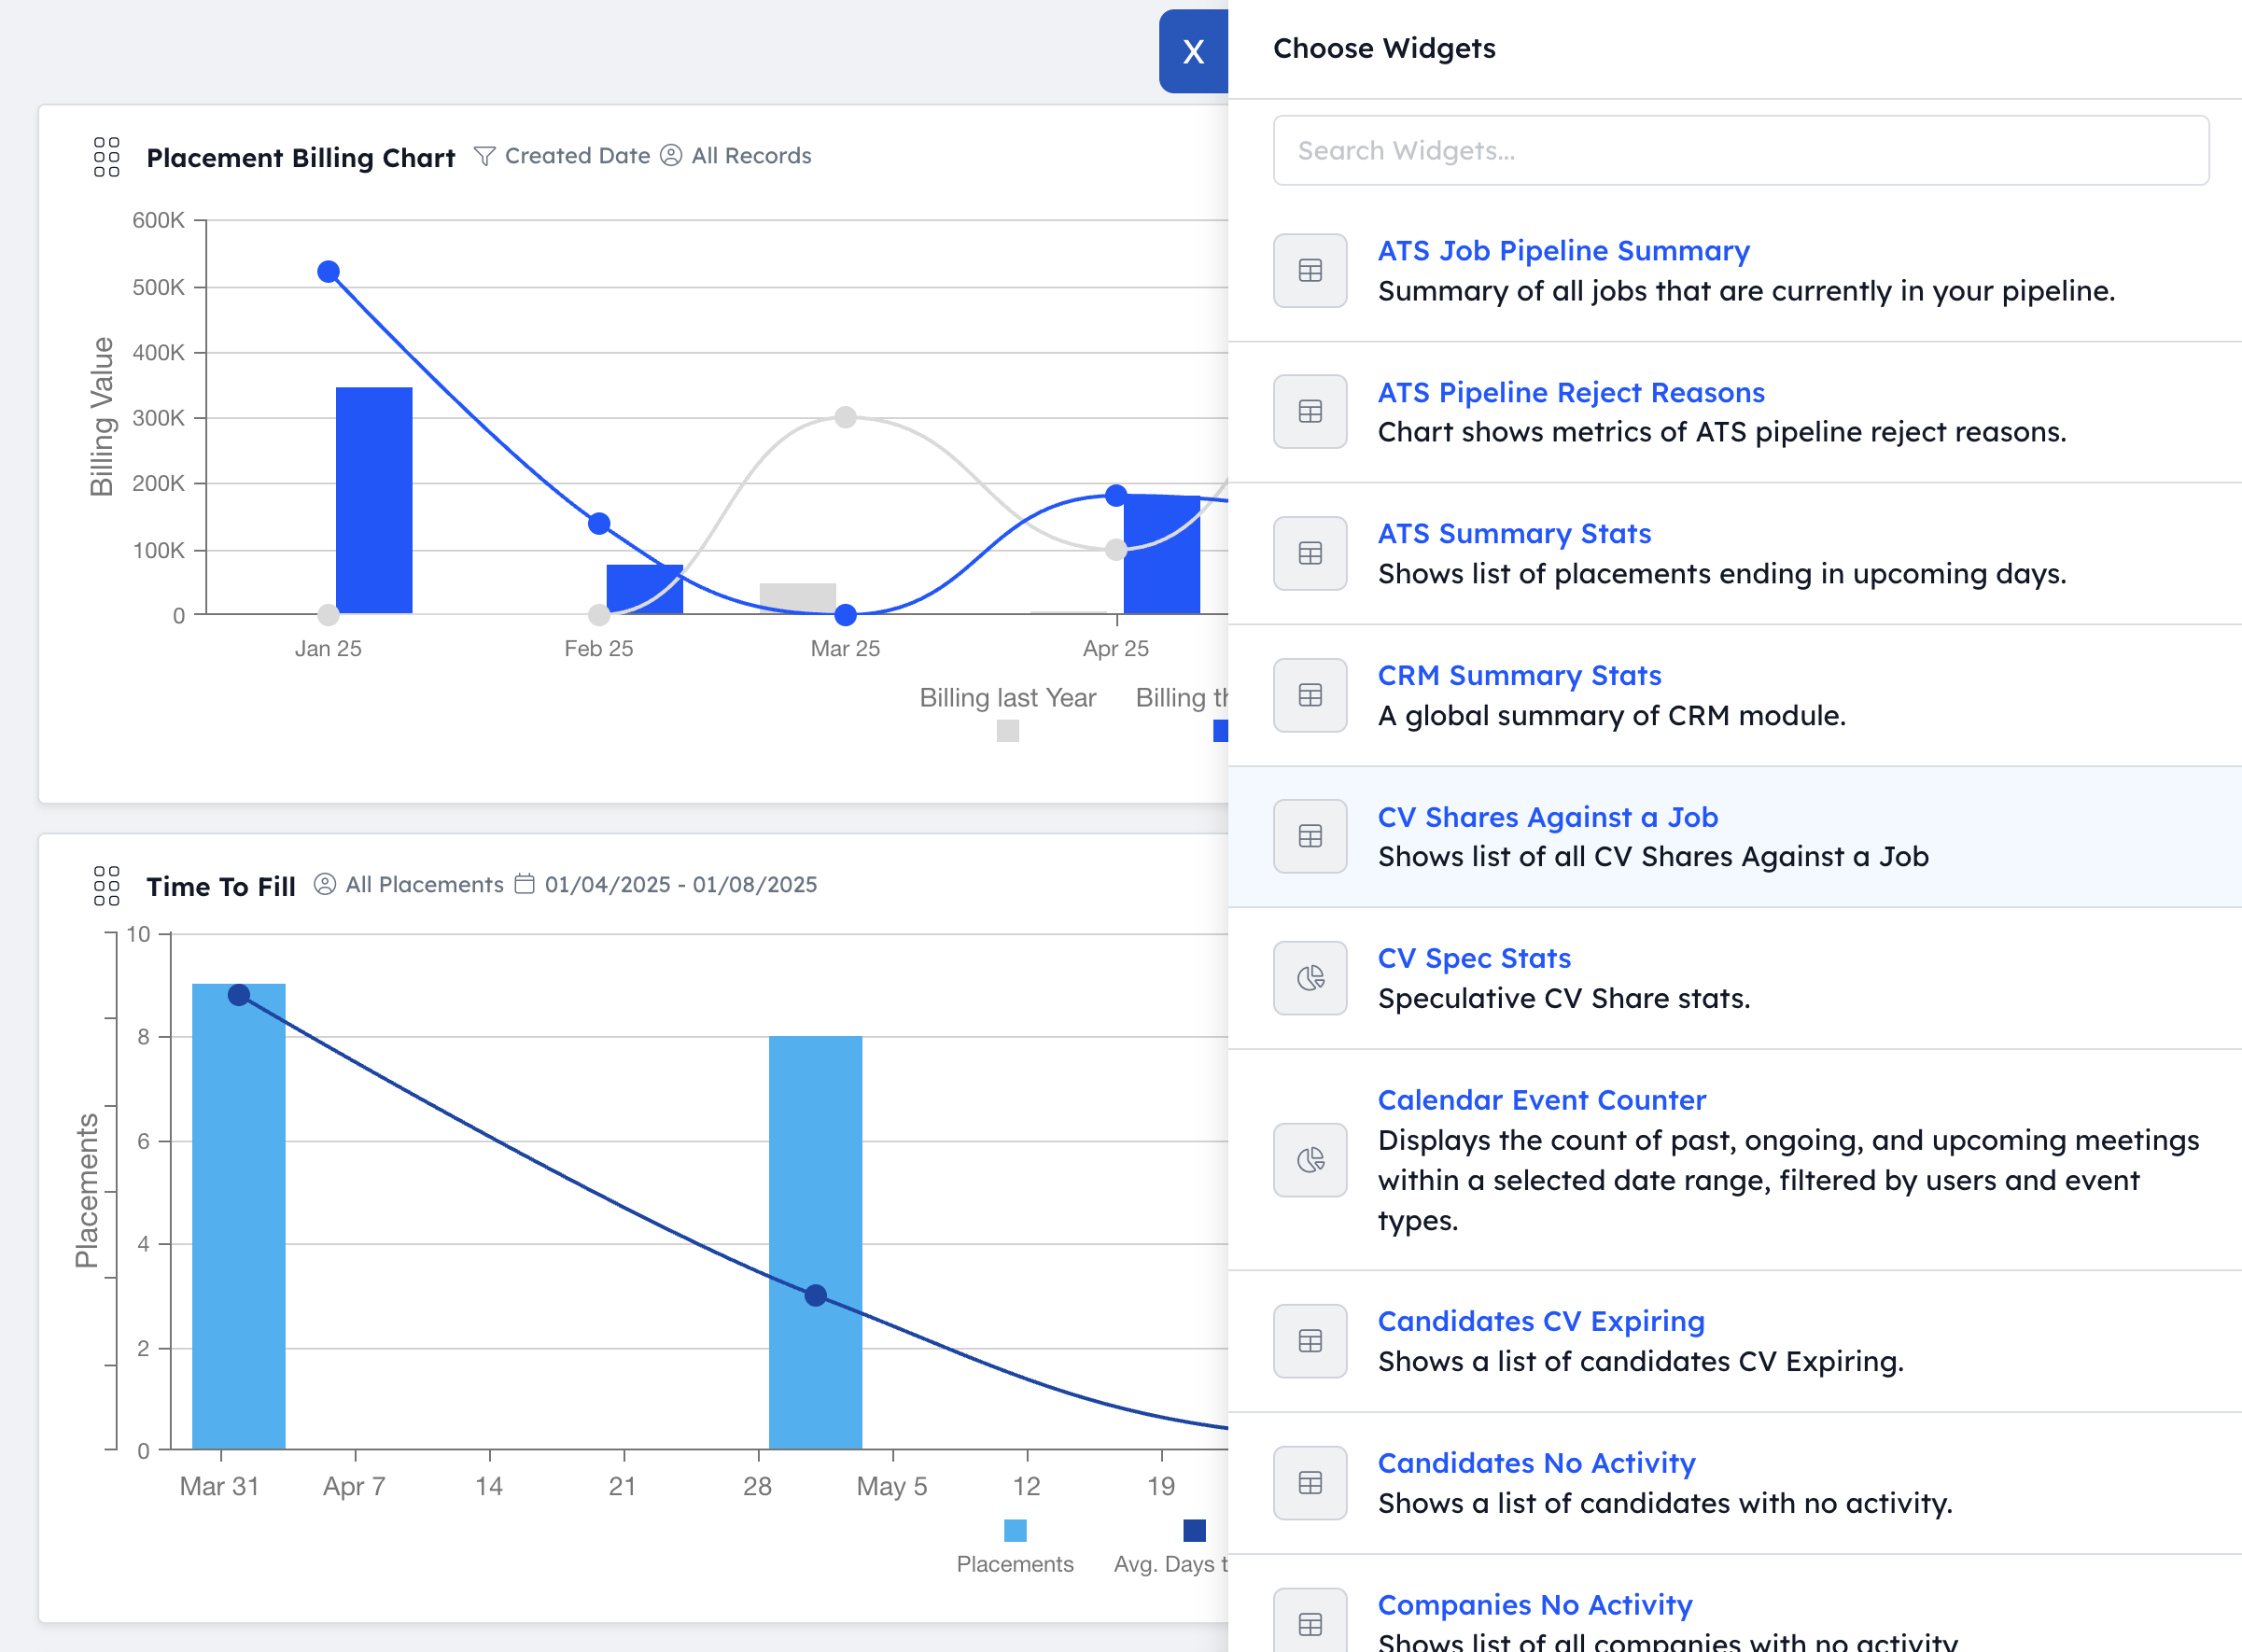
In recruitment, knowing your numbers is essential for success. Recruitly's KPI widgets transform complex data into actionable insights through intuitive visualisations and customisable dashboards.
Customisable Dashboard Experience
Create personalised dashboards that focus on the metrics that matter most to your role and business objectives. Choose from dozens of pre-built KPI widgets or design custom visualisations that display exactly the data you need for informed decision-making.
Real-time Performance Visibility
Track critical recruitment metrics as they happen with widgets that update automatically throughout the day. From placement counts and revenue figures to activity metrics and pipeline values, you'll always have your finger on the pulse of your business performance.
Multi-dimensional Data Analysis
Analyze performance across multiple dimensions with sophisticated data visualisation tools. Compare metrics by team, individual, time period, job type, industry, or any custom parameter to identify patterns, trends, and opportunities for optimisation.
Goal Progress Visualisation
Monitor progress toward individual, team, and organizational goals through intuitive visual indicators. Color-coded displays, progress bars, and gap-to-target metrics provide instant clarity on performance status and highlight areas needing attention.
Actionable Alerts & Notifications
Set performance thresholds that trigger alerts when metrics exceed or fall below expected ranges. These proactive notifications help you respond quickly to emerging issues or capitalize on positive momentum before traditional reporting would reveal the trend.
Executive Summaries & Team Views
Create role-specific dashboard views that present appropriate metrics at the right level of detail for different team members. From high-level executive summaries to detailed individual performance tracking, each user sees the insights most relevant to their responsibilities.
Use cases
Agency Management Dashboard
Give leadership a comprehensive view of business performance including revenue, placements, pipeline value, and team productivity metrics in one centralized display.
Individual Recruiter Scorecards
Provide each team member with personalised KPI tracking that shows their performance against targets for placements, activities, and revenue generation.
Client Performance Tracking
Monitor metrics specific to key clients including job fill rates, time-to-fill, candidate quality, and revenue generation to optimise account management.
Job Board ROI Analysis
Analyze the performance of different job boards and sourcing channels to determine which deliver the best candidates and highest placement rates.
Team Comparison & Benchmarking
Compare performance metrics across different teams, offices, or regions to identify best practices and areas for improvement throughout the organization.
Integrations
Questions
Absolutely. While Recruitly comes with dozens of recruitment-specific KPI templates, you can also create completely custom metrics based on any data in your system. This includes complex calculated fields, weighted scoring models, and composite indicators that combine multiple data points into meaningful business metrics.
Most KPI widgets update in real-time or near-real-time as data changes in your system. Dashboard refreshes are automatic, ensuring you always see the latest metrics without manual updating. For complex calculations or large datasets, updates may occur at scheduled intervals (typically every 15-30 minutes) to optimise system performance.
Yes, each user can configure their personal dashboard with the KPI widgets most relevant to their role and responsibilities. Administrators can also create and assign role-based dashboard templates for different job functions, ensuring consistent metrics tracking while allowing for personal customization.
Yes, Recruitly offers a display mode specifically designed for shared screens in office environments. You can configure dashboards optimised for TV display with larger visuals, rotating content, and simplified layouts that focus on team performance and goal progress. These displays can be set to refresh automatically and support secure, browser-based access.
Yes, Recruitly's KPI system tracks both outcome metrics (placements, revenue) and activity metrics (calls made, interviews arranged, etc.). This balanced approach ensures you can monitor both results and the underlying activities that drive those results, providing a complete picture of performance and helping identify areas for coaching or process improvement.
The Professional plan allows up to 10 widgets per dashboard with a total of 3 custom dashboards per user. The Enterprise plan removes these limits, allowing unlimited widgets and custom dashboards to accommodate more complex reporting needs and specialised team views. All plans include the full library of pre-built widgets.
Key benefits
Gain instant visibility into critical business and performance metrics
Identify trends and patterns that affect recruitment outcomes
Make data-driven decisions based on accurate, real-time information
Increase accountability through transparent performance tracking
Detect issues early through proactive monitoring and alerts
Save time with automated data collection and visualisation
Focus team attention on the most important performance indicators
Communicate progress and results more effectively to stakeholders
Celebrate achievements visually to boost team morale
Drive continuous improvement with comparative analytics
How it works
Customisable Dashboards
Create personalised dashboards with drag-and-drop widgets focused on the metrics that matter most to different roles and objectives.
Pre-built KPI Templates
Choose from dozens of recruitment-specific KPI templates designed to track common metrics like placements, revenue, activities, and pipeline values.
Interactive Data Visualisations
Explore performance data through interactive charts, graphs, and visual displays that support drill-down analysis and multi-dimensional comparisons.
Goal Progress Tracking
Monitor progress toward individual, team, and organizational goals with visual indicators that show achievement levels and gap-to-target metrics.
Performance Alerts
Set customisable thresholds that trigger notifications when KPIs exceed or fall below expected ranges, enabling proactive management.
Data Export & Sharing
Export dashboard visualisations and KPI reports in multiple formats for presentations, team meetings, and stakeholder communications.
See KPI/Goals & Widgets on your own data
Start free and try it, or have someone walk you through it on a call.
Best Value & Best Ease of Use · Capterra 2026